


Originally published August 24, 2021 @ 6:58 am
The nfsiostat is an excellent tool for analyzing NFS performance. The only major problem with this utility is that it’s designed to be used interactively. It does not have logging or timestamping capabilities. I needed to get information about NFS mount performance during a nightly backup, and I didn’t really feel like sitting in front of the computer at three in the morning, and so I put together a small wrapper script for nfsiostat.
The output produced by nfsiostat is spread over multiple lines and is not easily greppable. So what I needed to do is merge the output into a single line for each update, remove any extraneous characters and spaces, prepend a timestamp, and write the output to a log file.
The difficulty here was the buffered output generated by nfsiostatthat also includes some Windows-like control characters (^M, for example – no idea why). So I had to rely on the unbuffer utility to pipe the output of nfsiostat to multiple other commands that would massage the text into the desired format.
The script is below, and you can also download it from my GitHub repo. There are a few basic prerequisites listed in the script.
The wrapper script takes three arguments: refresh interval in seconds, refresh count, and NFS mountpoint (only one is supported). For example, if your NFS mount is /downloads and you want to gather NFS performance stats every 5 seconds for an hour, then the command will be:
./nfsiostat_wrapper.sh 5 720 "/downloads"

# I suggest you run it using nohup like so:
nohup ./nfsiostat_wrapper.sh 5 720 "/downloads" </dev/null >/dev/null 2>&1 &

# You can also schedule it via atd. When scheduling via atd or cron, make sure to
# provide the absolute path to the wrapper script.
at "3:10am tomorrow" <<<"/var/adm/bin/nfsiostat_wrapper.sh 5 720 /downloads"
The script will place the resulting CSV file in /var/tmp/nfsiostat folder. The CSV header will contain all the metrics displayed by nfsiostat. Here’s an example:
I was pretty proud of myself for getting this to work, but looking at this mess of data, I knew I would need to make a timeline chart. Here’s the list of all the fields in the CSV file:
1   timestamp
2   op_s
3   rpc_bklog
4   r_ops_s
5   r_kB_s
6   r_kB_op
7   r_retrans
8   r_retrans_pct
9   r_avg_RTT_ms
10  r_avg_exe_ms
11  w_ops_s
12  w_kB_s
13  w_kB_op
14  w_retrans
15  w_retrans_pct
16  w_avg_RTT_ms
17  w_avg_exe_ms
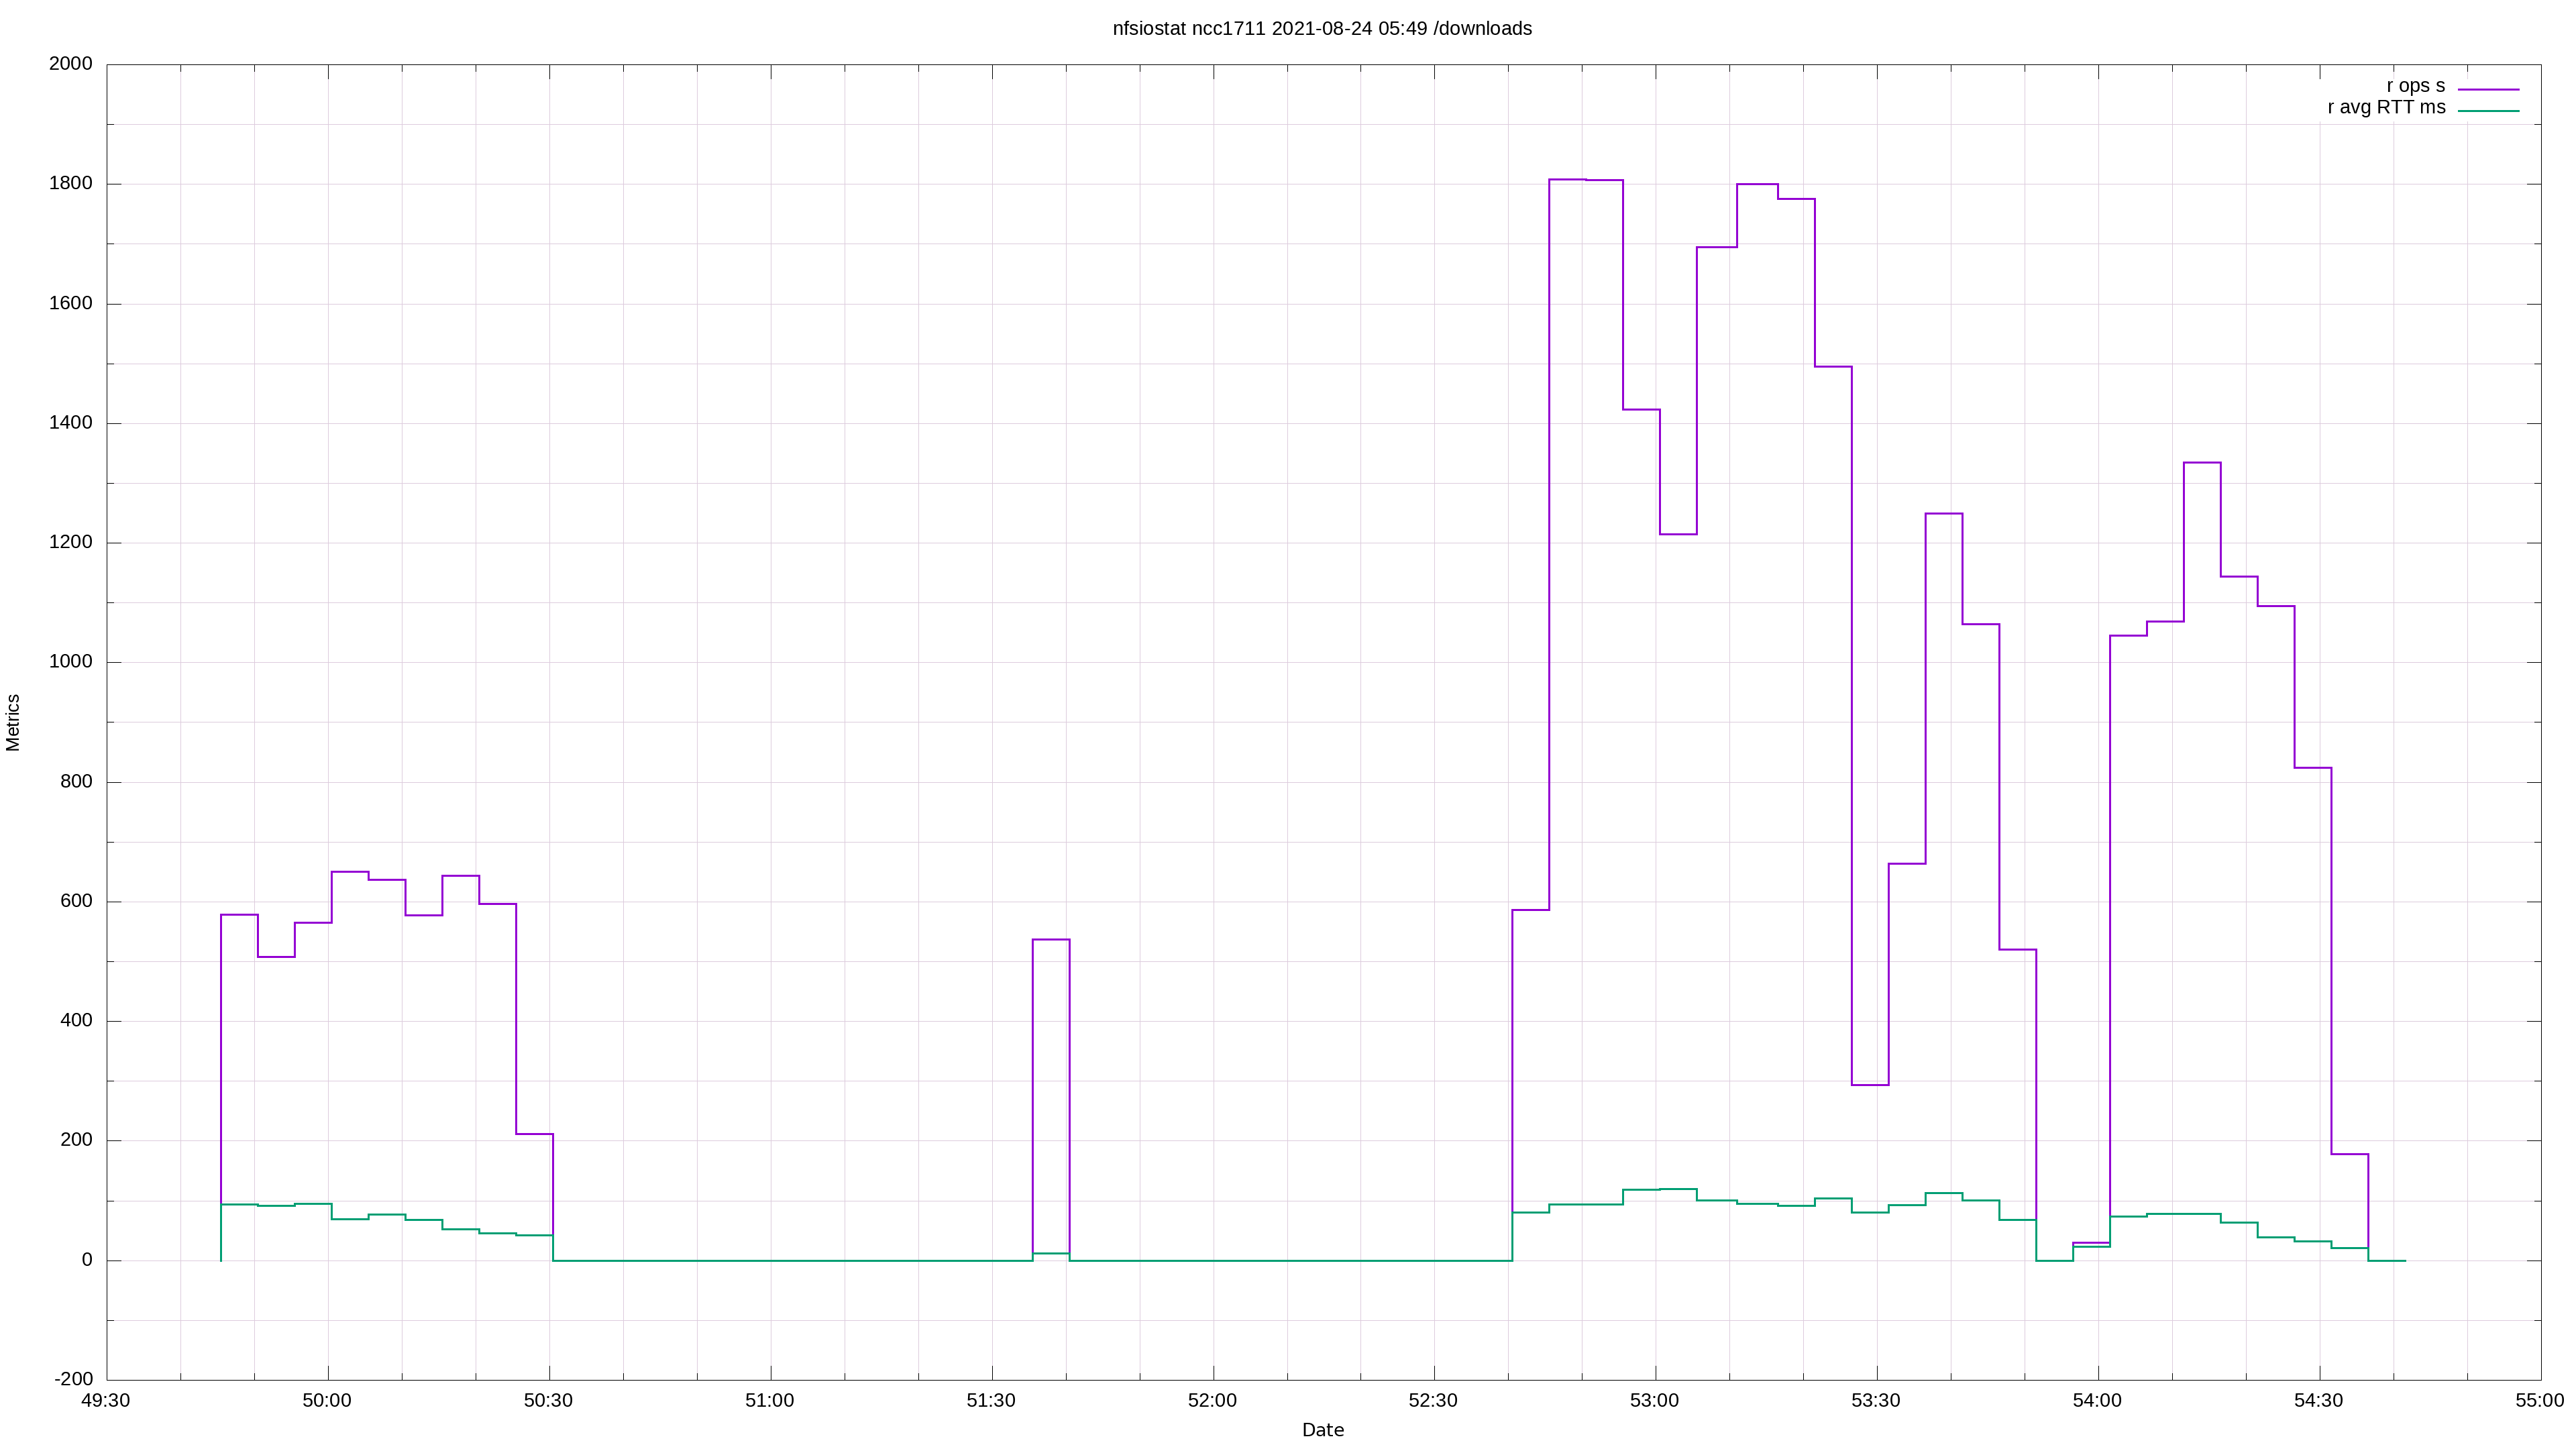
I will plot field #4 (read operations per second) and field #9 (read average RTT) in the example below. You can combine multiple metrics, as long as it makes sense to consider them together and you’re not trying to compare apples to oranges.
gnuplot -e "set title 'nfsiostat ncc1711 2021-08-24 05:49 /downloads';
set key;
set datafile separator ',';
set offset 1,1,1,1;
set autoscale xy;
set mxtics; set mytics;
set style line 12 lc rgb '#ddccdd' lt 1 lw 1.5; set style line 13 lc rgb '#ddccdd' lt 1 lw 0.5;
set grid xtics mxtics ytics mytics back ls 12, ls 13;
set terminal png size 3840,2160 enhanced font '/usr/share/fonts/truetype/liberation/LiberationSans-Regular.ttf,22';
set output '/mnt/nas04/downloads/${logfile}.png';
set style data labels;
set timefmt '%Y-%m-%d %H:%M:%S';
set xdata time;
set xlabel 'Date' font '/usr/share/fonts/liberation/LiberationSans-Regular.ttf,20';
set ylabel 'Metrics' font '/usr/share/fonts/truetype/liberation/LiberationSans-Regular.ttf,20';
plot \
'${logfile}' using 1:4 title '$(head -1 ${logfile} | awk -F, '{print $4}' | sed 's/_/ /g')' with histeps lw 3, \
'${logfile}' using 1:9 title '$(head -1 ${logfile} | awk -F, '{print $9}' | sed 's/_/ /g')' with histeps lw 3"
When troubleshooting NFS performance issues, the critical fields to watch are r/w retransmit (fields 7 & 14) and r/w avg RTT (fields 9 & 16). A substantial increase in these four parameters may indicate a performance bottleneck resulting from network misconfiguration or an issue with the NFS client or your NAS.

Experienced Unix/Linux System Administrator with 20-year background in Systems Analysis, Problem Resolution and Engineering Application Support in a large distributed Unix and Windows server environment. Strong problem determination skills. Good knowledge of networking, remote diagnostic techniques, firewalls and network security. Extensive experience with engineering application and database servers, high-availability systems, high-performance computing clusters, and process automation.
